THE RESEARCH LIBRARY

Maps. Images.
Questions to follow.

Explore the ocean floor and ancient Earth. Compare the book’s diagrams with actual landscapes and spacecraft records. Each reference keeps its own source, method and date.

Go to the primary sources Research Review resources ↓
SEPTEMBER 2026

Research Review resources.

Read the Online chapter reader alongside its diagrams, references and proposed tests. The companion’s chapter reader follows the Vision Edition.

01 / MAPS & MEASUREMENTS

Two independent globes.

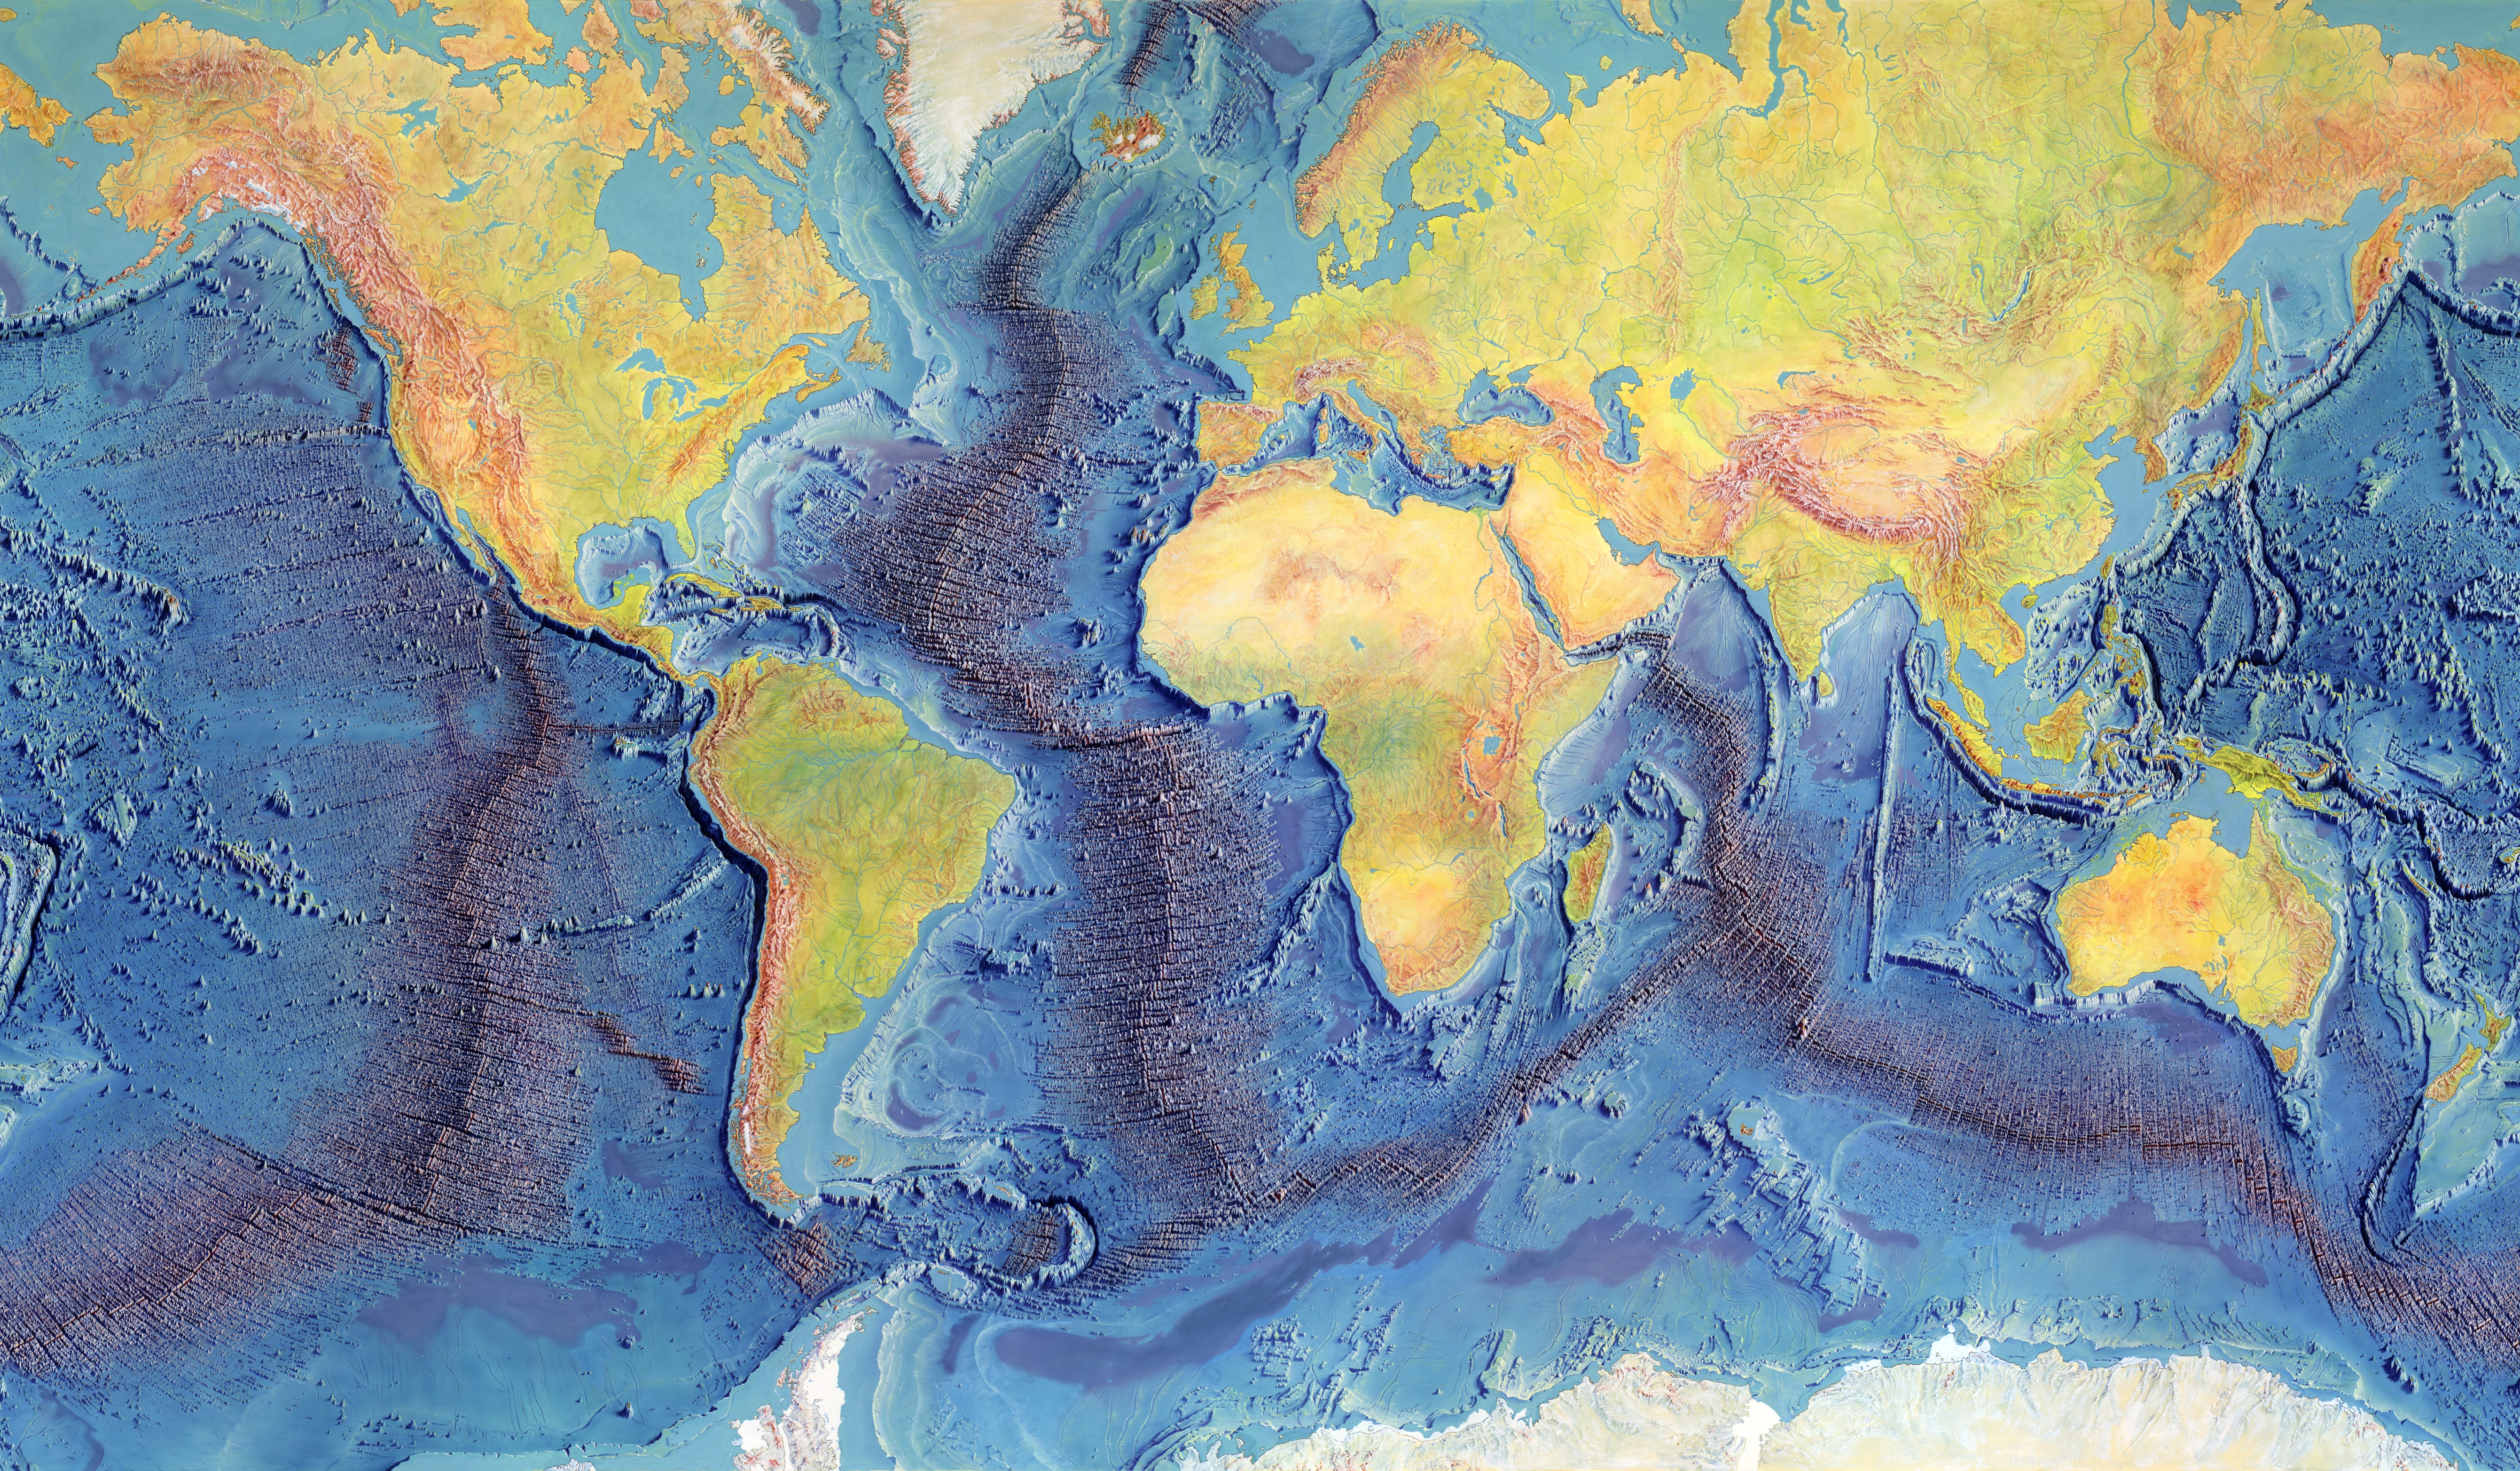
The Tharp ocean-floor map and the published PALEOMAP reconstruction remain dedicated references.

Explore both maps ↓
02 / IMAGES & RECORDS

See the actual features.

Fourteen credited field, satellite and planetary images, with processing and original source links.

Open the image library →
03 / THE BOOK’S CONNECTIONS

Keep the argument close.

Eighteen story beats connect the authors’ sequence to the full chapters, diagrams and 3D work.

Follow the story guide →
02 / PALEOMAP REFERENCEOn this site
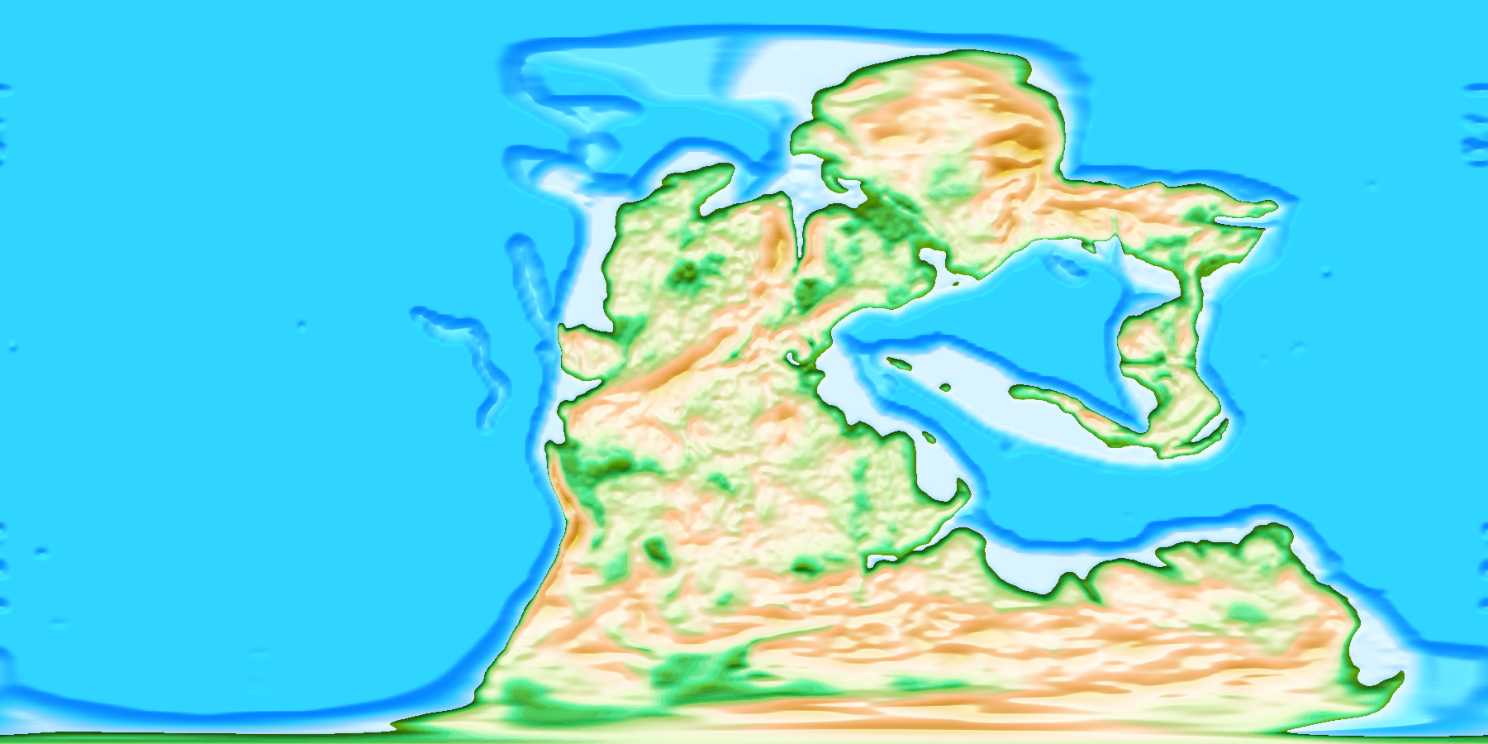
The actual GPlates PaleoDEM reference map at 250 million years ago, by Scotese and Wright
Scotese & Wright, 2018 · original GPlates reference imagery · CC BY 4.0

The GPlates maps, in our 3D.

The published PALEOMAP images on a dedicated reference globe, paired with the authors’ reconstructed elevations and ocean depths.

Explore PALEOMAP in 3D

Choose 250 Ma for Pangea, 0 Ma for today, or any of the 109 published stages reaching back 540 million years. Rotate, zoom and inspect raw terrain heights.

A separate published reference, like the Tharp globe. Ancient terrain and shorelines are reconstructed estimates; our experimental model is linked below.

OUR MODEL / SEPARATE RESEARCH DEMO

Explore our reconstruction.

Published coastlines, land heights and ocean depths now drive our Pangea-to-today surface. Explore the derived transitions between 51 dated maps, or open the separate continental material study. Both reference globes above remain independent.

Open our reconstruction
BEYOND THE MAPS

A library of
real views.

From a glacier front in Greenland to Caloris on Mercury, compare the book’s account with a specific observed feature. Credits, acquisition dates and scientific image processing travel with each record.
Browse all fourteen images →
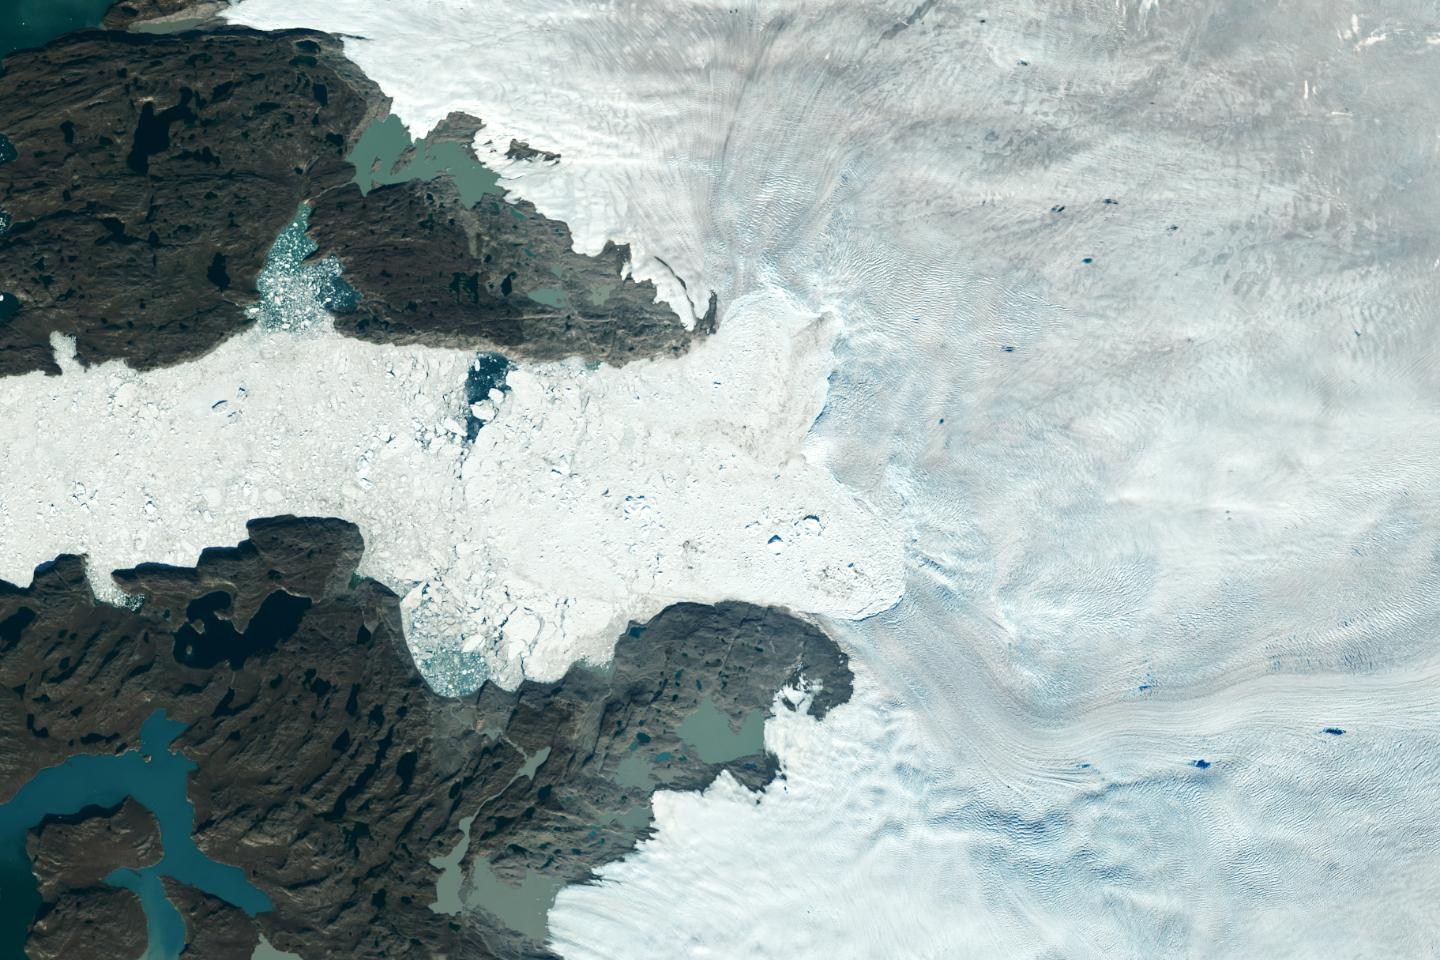
Satellite image of the Jakobshavn glacier front and ice-filled waters in Greenland.
Jakobshavn, Greenland · Satellite image
NASA/USGS · Complete image credit & record ↗
FOLLOW THE SOURCE

Maps, measurements
& reconstruction models.

Primary sources for closer reading. External links open in a new tab.

HISTORICAL MAP / COLUMBIA

The Heezen–Tharp map

The original 1977 map, its creators and the observations behind its painted ocean landscape.

Visit Columbia
ANCIENT RELIEF / PALEOMAP

Scotese & Wright, 2018

Estimated ancient land elevations and ocean depths, with the method and limits of the PaleoDEM reconstructions.

Read at EarthByte
PLATE MOTION / MÜLLER ET AL.

A deforming Earth model

The 2019 model reconstructs plate motion, rifting and continental deformation from the Triassic to today.

Paper & model data
MODERN TERRAIN / GEBCO

The GEBCO 2026 grid

A global elevation compilation, with a source-type grid distinguishing measurements from other data types.

Explore GEBCO 2026
MODERN TERRAIN / NOAA

ETOPO 2022

A global relief model combining land and ocean data, with separate ice-surface and bedrock versions.

Explore NOAA ETOPO

Linked research is provided for comparison and further study. Each dataset and reconstruction retains its own methods, dates and limitations.

CONTINUE THE INQUIRY

Keep the map close.
Keep the sources closer.

Browse the 69 book plate placements ↗ · Open the original research and references ↗